Motif finding exercise
In this exercise we will try a few de-novo motif finding programs on data sets from human and mouse. We will also compare the motifs we find to a database of known motifs.
0. Set up
Log in to Uppmax, and start an interactive session.
Load the modules we will use in the exercise:
module load bioinfo-tools
module load BEDTools
module load HOMER
Create a working directory where you will do the exercise, and go there. For example:
mkdir motif_lab
cd motif_lab
Note that the programs used in this exercise produce html output. You view these directly on Uppmax, though this is a bit slow. Otherwise you can copy the files to you local computer, and open them there.
1. Download CTCF data
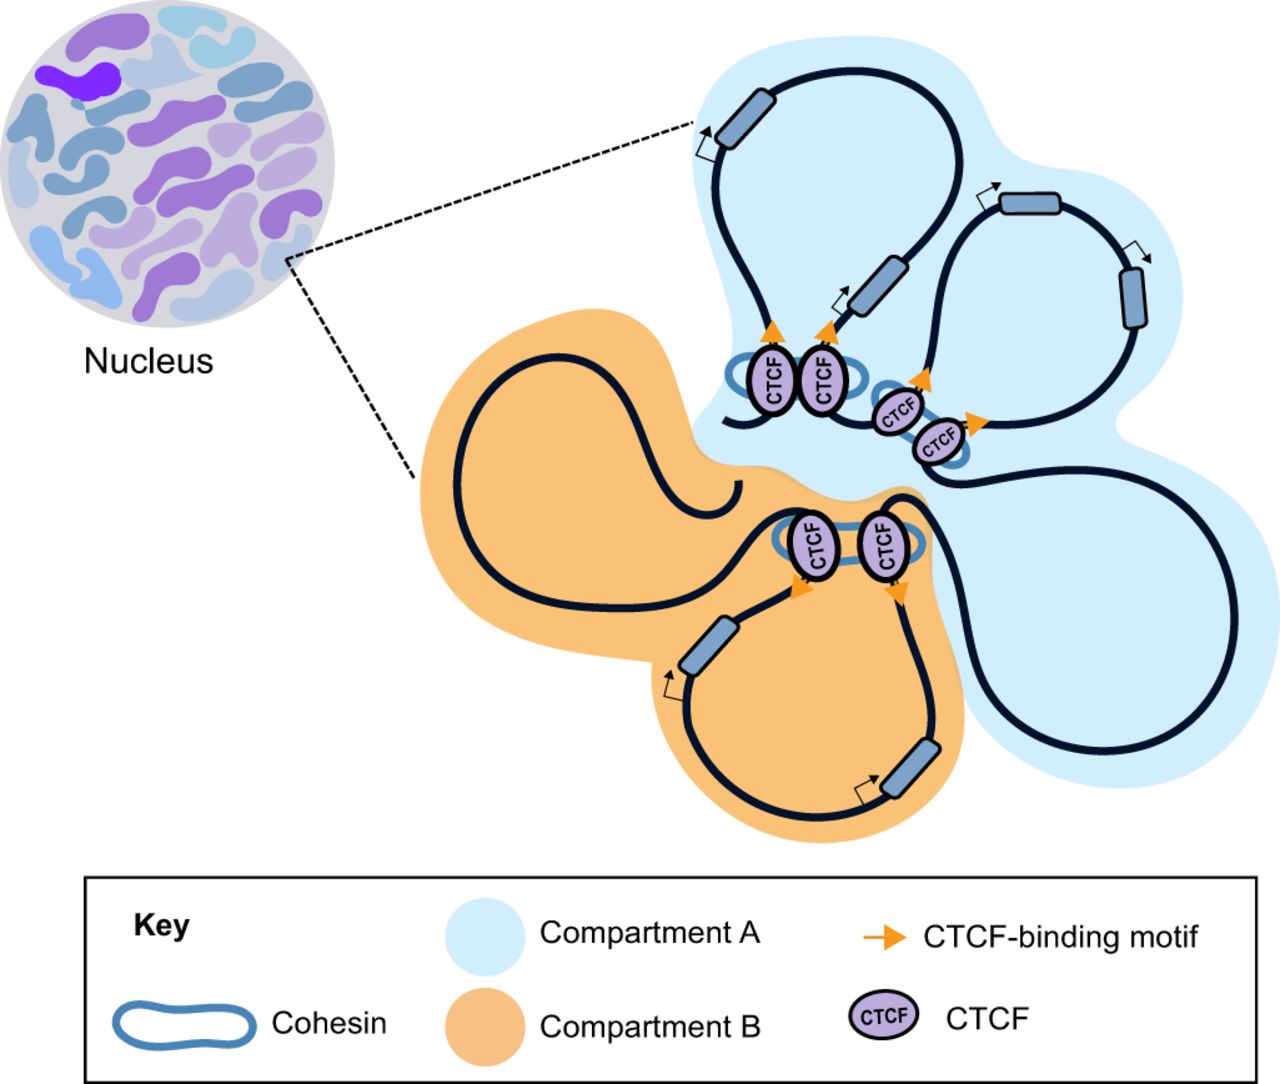
First, we will look at a ChIP-seq experiment using an antibody against CTCF. CTCF (CCCTC-binding factor) is a zinc-finger protein that functions as a transcription factor. It also has insulator activity and is important for the 3D structure of chromatin, through formation of chromatin loops.
CTCF is a well studied protein, and many ChIP-seq data sets are available for CTCF. Its DNA motif is well known (as you can tell from its name).

We will use this data set, from ENCODE. This page shows information about this particular experiment, along the experimental protocols and analysis pipelines used. Scroll down a bit and select the tab “File details”. Now you will see a list of files available for download. We will use the bed files with “pseudoreplicated idr thresholded peaks”. Download this file:
wget https://www.encodeproject.org/files/ENCFF693MYU/@@download/ENCFF693MYU.bed.gz
gunzip ENCFF693MYU.bed.gz
2. Prepare peak data
The peaks are on the “narrowPeak bed format”, described here
Have a look at the file:
less ENCFF693MYU.bed
It’s often a good idea to just use the peaks with the strongest signal for motif finding. This is becuase a) motif finding programs have a hard time handling large inputs, and b) the peaks with the strongest signal are most likely to be true binding sites and to contain the motif of interest. Therefore, we will run motif finding on the top 500 peaks. To get the top 500 peaks, we first sort the peaks on “signalValue” in column 7 (using the sort command) and then take the first 500 peaks (using the head command):
sort -k 7,7nr ENCFF693MYU.bed | head -n 500 > ENCFF693MY_top500.bed
Have look at the resulting file:
less ENCFF693MY_top500.bed
3. Prepare sequence data
Next, we need to get the genome sequence at these 500 peaks. Since repeat elements can confuse the motif finding programs, we will use a repeat-masked version of the genome, where all repeat sequences have been replaced with Ns. Create a soft link to the repeat masked genome in you working directory:
ln -s /sw/courses/epigenomics/motif_finding/hg38.masked.fa* .
We will now use bedTools to extract the genome sequence for the 500 peaks:
bedtools getfasta -fo CTCF_top500_peak_seq.fa -fi hg38.masked.fa -bed ENCFF693MY_top500.bed
You can see the documentation for the program you just used here. Now, have a look at the fasta file produced:
less CTCF_top500_peak_seq.fa
4. Use the MEME suite for motif finding
We will now run some programs from the MEME suite. These are available on Uppmax though the MEMEsuite module, but currently there are some problems with this installation. Instead, we will run the programs inside a container. For more information on containers, we refer to the course Tools for reproducible research.
First we try DREME, which is a fast program that looks for regular expressions (documentation DREME). This takes a few minutes to run:
singularity exec \
  /sw/courses/epigenomics/motif_finding/meme.sif \
  dreme -p CTCF_top500_peak_seq.fa -oc dreme_out
DREME produces several output files. Take a look at the html file:
firefox dreme_out/dreme.html
You see a list of motifs represented as regular expressions and sequence logos, along with e-values and some links.
Next, we will try MEME-ChIP. This is a wrapper that runs several programs, including MEME, Spamo and Centrimo. It takes bit longer to run, around 10 minutes:
singularity exec \
  /sw/courses/epigenomics/motif_finding/meme.sif \
  meme-chip -oc meme_chip_out CTCF_top500_peak_seq.fa
This produces several output files. The file meme_chip_out/meme-chip.html is a good starting point to look at the results. Open this file in a web browser:
firefox meme_chip_out/meme-chip.html
Here you can see all motifs found by MEME, with e-values etc.
What can you learn from all this output? Did MEME find the expected motif? Did it find other motifs? Where are the motifs located in the peaks? How are the motifs located with respect to each other?
5. What are the motifs we have found?
Often when we find a motif, we want to see if it is similar to any motif that is already known. One tool to do this is called Tomtom, and is part of the same suite of programs as MEME etc. To try this, open the MEME-chip output again.
There used to be a simple interface where motifs found be MEME could directly be exported to Tomtom, but this doesn’t work well. Instead we will upload the motifs manually. To do this go to the Tomtom web interface.
For the top motif, paste the following count matrix in the box under “Input query motifs”. Then click “Start Search”.
 11  142  293   23
  4  305    3  157
 16    4  416   33
 21  416    9   23
  1  465    1    2
166  284   12    8
  0  306    1  163
  1  468    0    1
 10   21   12  427
135   33  251   51
  4  110  345   11
 24  111   10  325
  1    1  466    2
  6   16  425   23
 67  288   24   90
For the second motif, use the following count matrix:
20   17   21   35
 9   17   52   15
20   23   25   25
20    0   63   10
 0    7   74   12
46   25    3   19
88    1    0    4
 2   74    0   17
 0    4    0   89
 0    0   93    0
 0   93    0    0
80    1   12    0
 2   14   69    8
 4   55   34    0
11   56    8   17
What is the top scoring motif? Does it look similar to the motif we found? What about other motifs further down the list?
6. Try HOMER
Finally, we will try another popular motif finding software, HOMER. Here we will look at a CTCF chipseq experiment from mouse. First, download the bed file with the peaks and select the top 500 peaks:
wget https://www.encodeproject.org/files/ENCFF311HPG/@@download/ENCFF311HPG.bed.gz
gunzip ENCFF311HPG.bed.gz
sort -k 7,7nr ENCFF311HPG.bed | head -n 500 > mouse_CTCF_top500.bed
Then run HOMER on the top 500 peaks. Note that HOMER comes with a number of pre-formatted genomes, so you just give it the coordinates of the peaks and tell it which genome you are looking at. This can take a while to run, around 20-30 minutes.
Have a look at the resulting html file. Here you can see a list of de-novo motifs found and which known motifs these are similar to. The program also scans the peaks for all known motifs, and indicates which motifs are enriched on the peak region. Klick on Known Motif Enrichment Results to see the results.
findMotifsGenome.pl mouse_CTCF_top500.bed mm10 homer_out_mouse_ctcf -size 200 -mask -preparsedDir tmp_homer/
firefox homer_out_mouse_ctcf/homerResults.html
What does HOMER find? Is this output easy to interpret?