Data Preprocessing for Functional Genomics
Learning outcomes
apply standard processing methods used in functional genomics on ATAC-seq data
become accustomed to work in interactive HPC environment (Rackham cluster)
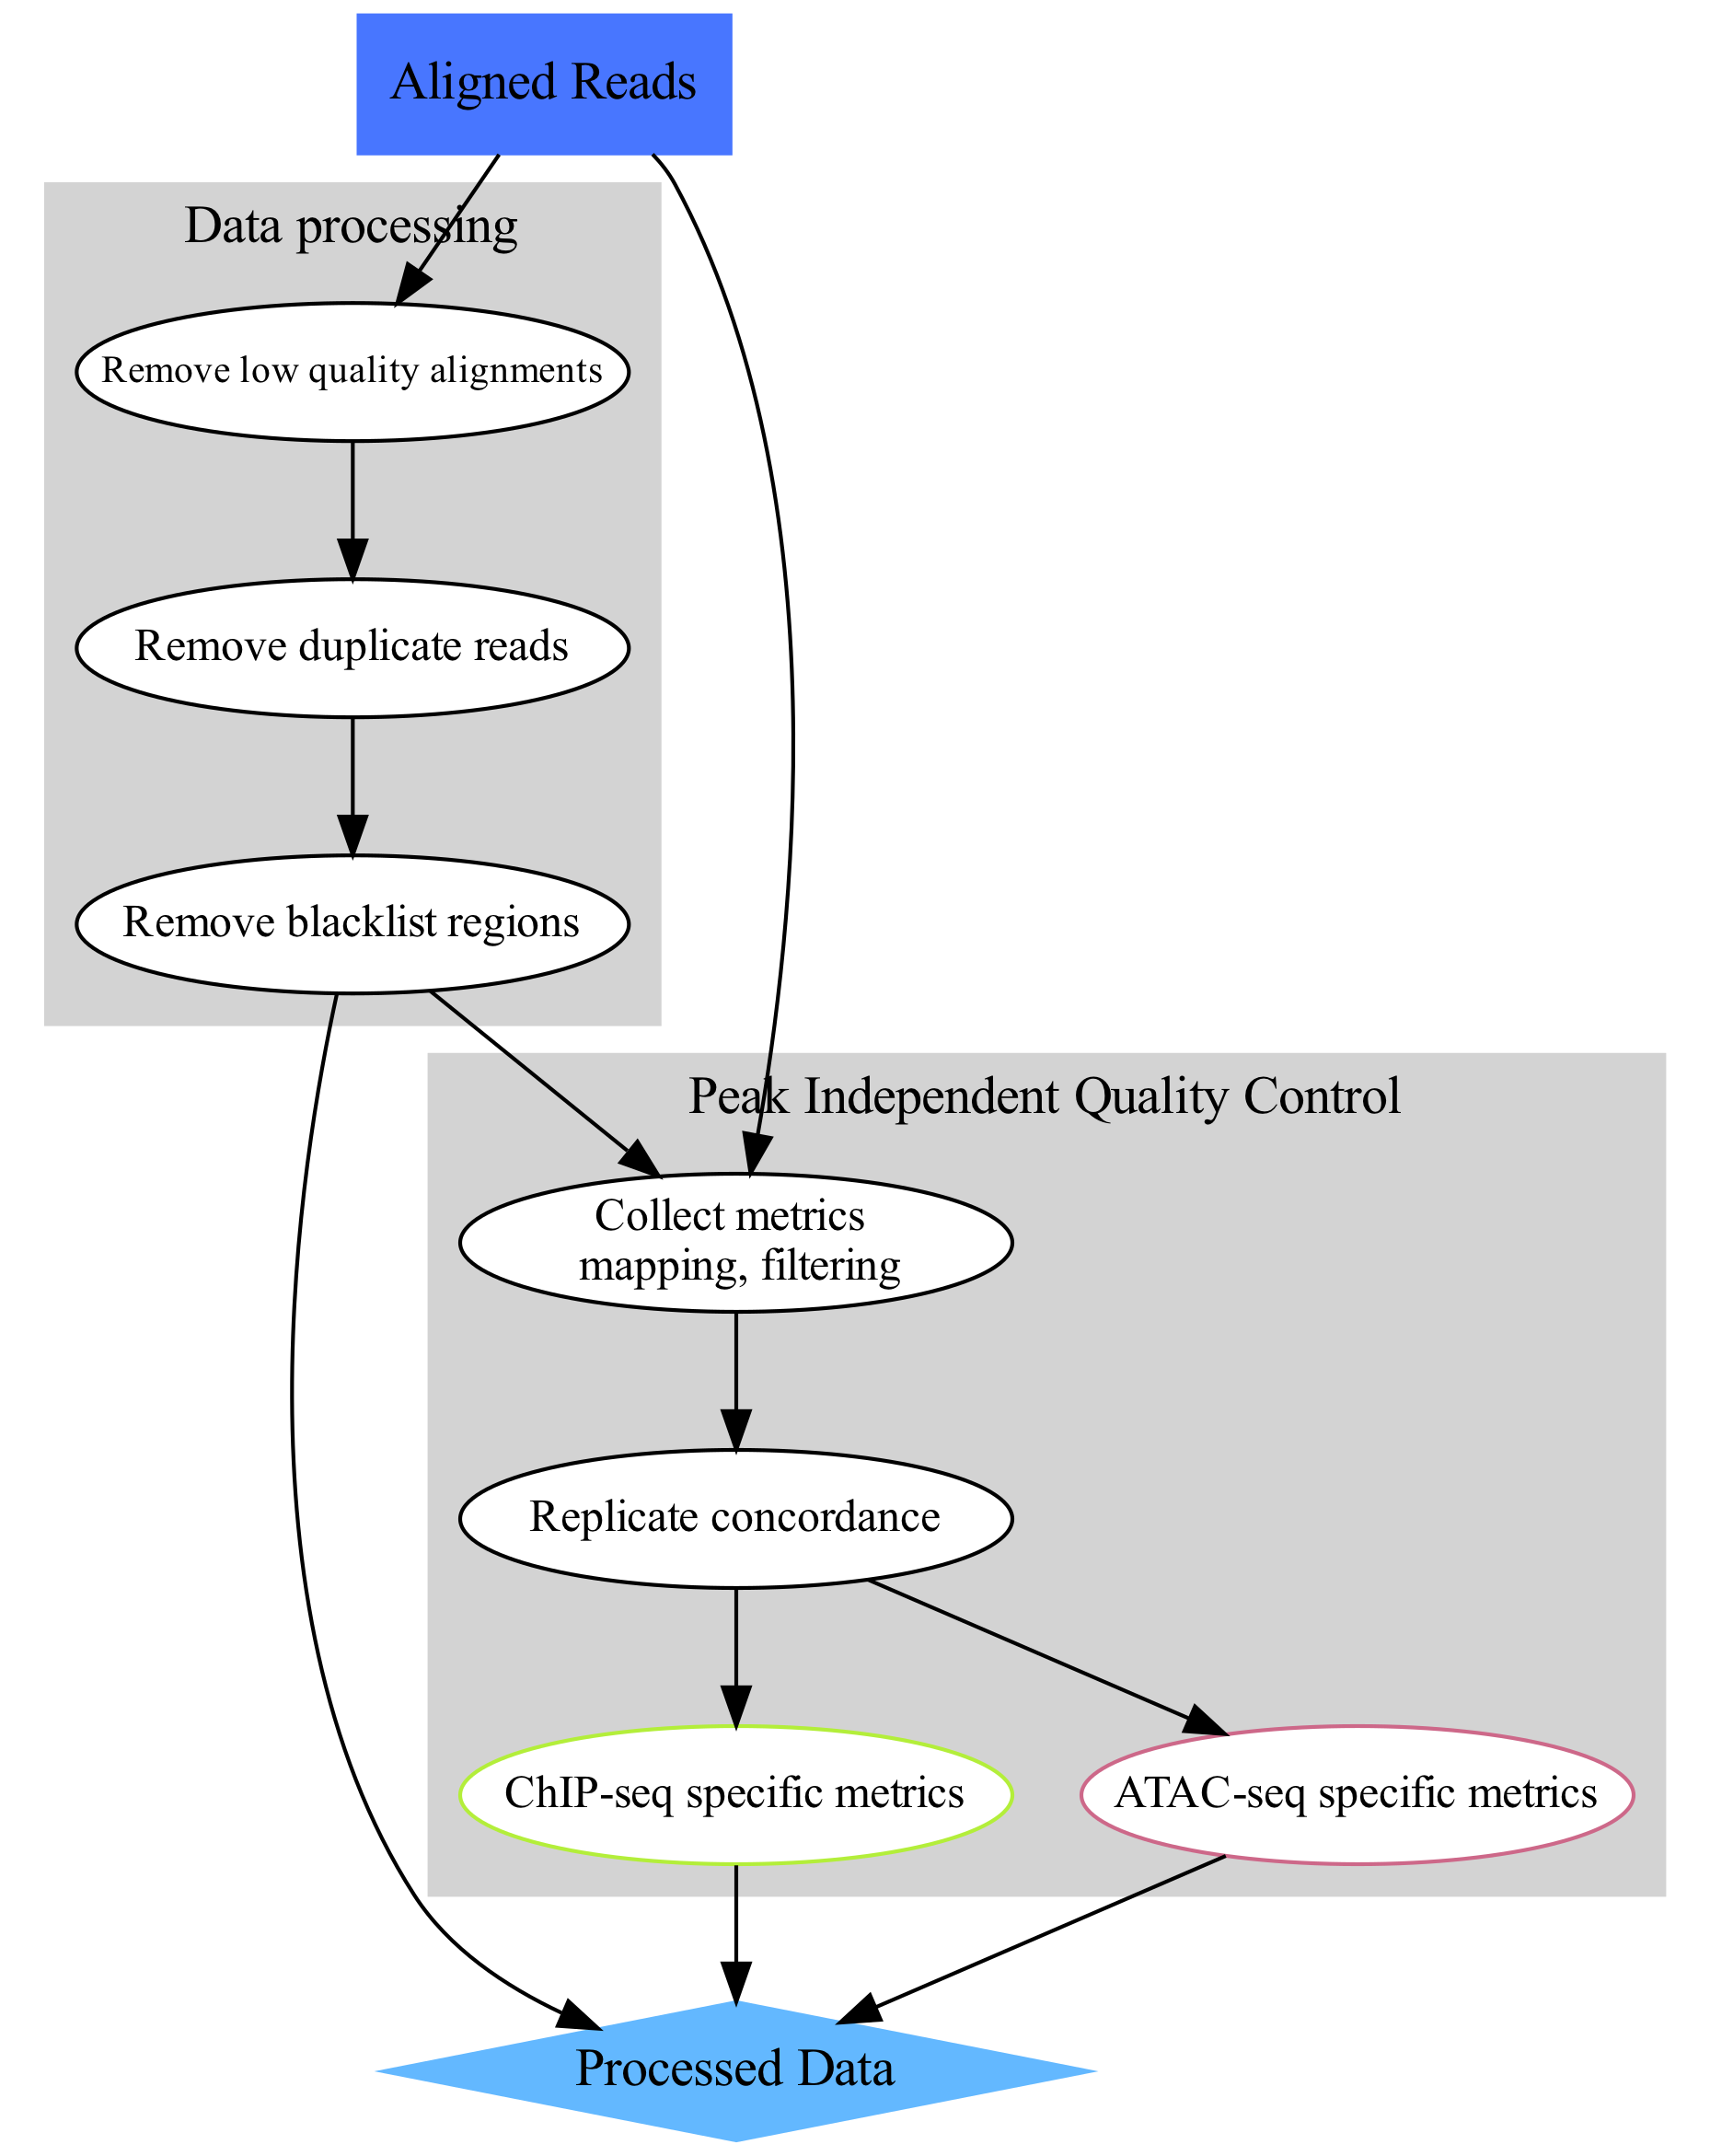
The aim of this part of the data analysis workflow is to remove alignments which most likely are artifacts and could interfere with data analysis (upper-left part of the concept map). These include:
alignments to organelles (mitchondria);
alignments within “blacklisted regions”: regions of unusually high signal in many functional genomics experiments, described in Amemiya et al;
low quality alignments;
duplicate alignments (i.e. both mates of a pair map to identical genomic locations).
We assume that starting point are reads mapped to a reference sequence.
Before we start
Today we are going to work on Rackham, an HPC cluster hosted by Uppmax.
Please follow the setup procedure to book a node and log in to it as described in section Setting up.
Data
We will work with ATAC-seq data in this tutorial, however the same principles apply to other functional genomics data types. In particular, ChIP-seq data used in this workshop has been processed using similar workflow.
We will use data that come from publication Batf-mediated epigenetic control of effector CD8+ T cell differentiation (Tsao et al 2022). These are ATAC-seq libraries (in duplicates) prepared to analyse chromatin accessibility status in murine CD8+ T lymphocytes prior to and upon Batf knockout.
The response of naive CD8+ T cells to their cognate antigen involves rapid and broad changes to gene expression that are coupled with extensive chromatin remodeling. Basic leucine zipper ATF-like transcription factor Batf is essential for the early phases of the process.
We will use data from in vivo experiment.
SRA sample accession numbers are listed in Table 1.
No |
Accession |
Sample Name |
Description |
|---|---|---|---|
1 |
SRR17296554 |
B1_WT_Batf-floxed_Cre_P14 |
WT Batf |
2 |
SRR17296555 |
B2_WT_Batf-floxed_Cre_P14 |
WT Batf |
3 |
SRR17296556 |
A1_Batf_cKO_P14 |
KO Batf |
4 |
SRR17296557 |
A2_Batf_cKO_P14 |
KO Batf |
We have processed the data, starting from raw reads. The reads were aligned to GRCm39 reference assembly using bowtie2 and subset to include alignments to chromosome 1 and 1% of reads mapped to chromosomes 2 to 5 and MT.
This allows you to see a realistic coverage of one selected chromosome and collect QC metrics while allowing shorter computing times.
Setting up directory structure and files
Normally you process several files from your data set using the same workflow. We are going to process just one file, as an example. In addition to the file with unprocessed alignments which will be our starting point, we will need annotation files. Files produced in this part will be used in downstream tutorials, therefore saving files in a structured manner is essential to keep track of the analysis steps (and always a good practice). We have preset data access and environment for you. To use these settings run:
atac_data.shthat sets up directory structure and creates symbolic links to data as well as copies smaller files [RUN ONLY ONCE]
Copy the script to your home directory and execute it:
cp /proj/epi2025/atacseq_proc/atacseq_data.sh .

bash atacseq_data.sh
You should see a newly created directory named atacseq. Everything you need for completing the ATAC-seq tutorials is located there. When you enter atacseq you’ll see several other directories. results contains precomputed results of (most of) the steps, so you can continue in case something goes wrong along the way. You can enter analysis; this is where we’ll be working today.
cd atacseq
ls .
cd analysis
Read Mapping Statistics
As stated above, we use data which has already been mapped to a reference.
To start with, we can inspect the statistics of these unprocessed data. We will be working in directory processedData:
mkdir processedData
cd processedData

module load bioinfo-tools
module load samtools/1.19

samtools idxstats ../../data/SRR17296554.mapped.bowtie2.chr1.bam  >SRR17296554.idxstats
samtools stats ../../data/SRR17296554.mapped.bowtie2.chr1.bam  >SRR17296554.stats
One of the characteristics of the ATAC-seq signal is the presence of reads mapped to organelles. These reads may constitute even 40% of the library, depending on the library preparation method. MT contents be used to flag failed libraries early on.
We can inspect the Mt contents of our data:
#total fragments
awk '{sum += $3} END {print sum}' SRR17296554.idxstats
11335599

#chrM fragments
awk '$1 ~ /MT/ {print $3}' SRR17296554.idxstats
75245
MT/total ratio in this file is 0.007 (thanks to data subsetting). The fraction of MT reads in the nonsubset file was 0.053, a value to be expected if using the Omni ATAC library prep. Older protocols result in much higher values.
Let’s inspect the read mapping statistics in SRR17296554.stats:
grep ^SN SRR17296554.stats | cut -f 2-

raw total sequences:    11399457        # excluding supplementary and secondary reads
filtered sequences:     0
sequences:      11399457
is sorted:      1
1st fragments:  5694081
last fragments: 5705376
reads mapped:   11335599
reads mapped and paired:        11271741        # paired-end technology bit set + both mates mapped
reads unmapped: 63858
reads properly paired:  11230312        # proper-pair bit set
reads paired:   11399457        # paired-end technology bit set
reads duplicated:       0       # PCR or optical duplicate bit set
reads MQ0:      5945    # mapped and MQ=0
reads QC failed:        0
non-primary alignments: 0
supplementary alignments:       0
total length:   420662620       # ignores clipping
total first fragment length:    210119227       # ignores clipping
total last fragment length:     210543393       # ignores clipping
bases mapped:   418303160       # ignores clipping
bases mapped (cigar):   417695422       # more accurate
bases trimmed:  0
bases duplicated:       0
mismatches:     822766  # from NM fields
error rate:     1.969775e-03    # mismatches / bases mapped (cigar)
average length: 37
average first fragment length:  37
average last fragment length:   37
maximum length: 37
maximum first fragment length:  37
maximum last fragment length:   37
average quality:        34.1
insert size average:    220.2
insert size standard deviation: 134.6
inward oriented pairs:  5597226
outward oriented pairs: 19488
pairs with other orientation:   1094
pairs on different chromosomes: 18062
percentage of properly paired reads (%):        98.5
Processing alignments
We start by removing alignments within problematic genomic regions.
We use mm38 specific blacklist from ENCODE, accession ENCFF999QPV, which was litover to GRCm39 using UCSC liftOver web tool.
We will perform this as a “complement” operation, i.e. we’ll retain alignments which overlap the non-blacklisted regions (complementBed from bedtools ).
Before we can do this we need to prepare the genomic regions:
module load BEDTools/2.31.1

sortBed -i  ../../annot/ENCFF999QPV.mm39_ens.bed  | complementBed -i stdin -g ../../annot/GRCm39.sizes > mm39.noblcklst.bed
While we are at it, we can also remove the MT contig from the non-blacklist regions:
awk '$1 != "MT" { print $0 }' mm39.noblcklst.bed > mm39.noblcklst_MT.bed
We can now remove the alignments in problematic reagions (blacklists and MT). Please note the bam file should be sorted and indexed first (required by samtools view), which we have done beforehand.
We retain alignments not within the blacklisted regions, which also are properly paired and of minimum MAPQ 5 (-f 0x2 -q 5):
samtools view -f 0x2 -q 5 -M -L mm39.noblcklst_MT.bed -hbo SRR17296554.blstMT_filt.bam ../../data/SRR17296554.mapped.bowtie2.chr1.bam

samtools index SRR17296554.blstMT_filt.bam
How many alignments are kept?
samtools idxstats SRR17296554.blstMT_filt.bam >SRR17296554.blstMT_filt.idxstats

awk '{sum += $3} END {print sum}' SRR17296554.blstMT_filt.idxstats
9440817 alignments are retained after filtering (out of initial 11335599).
Finally, we can mark / remove duplicated alignments.
module load picard/3.1.1

java -Xmx31G -jar $PICARD MarkDuplicates -I SRR17296554.blstMT_filt.bam \
 -O SRR17296554.blstMT_filt.dedup.bam -M SRR17296554.dedup_metrics \
 -VALIDATION_STRINGENCY LENIENT -REMOVE_DUPLICATES false -ASSUME_SORTED true

samtools index SRR17296554.blstMT_filt.dedup.bam
Resulting file SRR17296554.blstMT_filt.dedup.bam containes preprocessed alignments we can use in the analysis and visualisations.
While we are at it, we can inspect the duplication status of the library. This is another early QC step we perform, and it informs us of library complexity.
head SRR17296554.dedup_metrics
Key information from SRR17296554.dedup_metrics:
READ_PAIRS_EXAMINED 4720408
READ_PAIR_DUPLICATES 1389167
PERCENT_DUPLICATION 0.29429
Inspecting file contents.
## METRICS CLASS picard.sam.DuplicationMetrics
LIBRARY UNPAIRED_READS_EXAMINED READ_PAIRS_EXAMINED SECONDARY_OR_SUPPLEMENTARY_RDS UNMAPPED_READS UNPAIRED_READ_DUPLICATES READ_PAIR_DUPLICATES READ_PAIR_OPTICAL_DUPLICATES PERCENT_DUPLICATION ESTIMATED_LIBRARY_SIZE
Unknown Library 0 4720408 0 0 0 1389167 0 0.29429 6354197
Good news, acceptable duplication level in this library, we can proceed with further QC and analysis.
References
Tsao, Hsiao-Wei, James Kaminski, Makoto Kurachi, R. Anthony Barnitz, Michael A. DiIorio, Martin W. LaFleur, Wataru Ise, et al. 2022. “Batf-Mediated Epigenetic Control of Effector CD8 + t Cell Differentiation.” Science Immunology 7 (68). https://doi.org/10.1126/sciimmunol.abi4919.