Quality Control for Functional Genomics
This tutorial is a continuation of Data preprocessing.
Learning outcomes
apply quality control methods agnostic to signal structure, which are used in functional genomics, on an example of ATAC-seq data
become accustomed to work on Rackham cluster
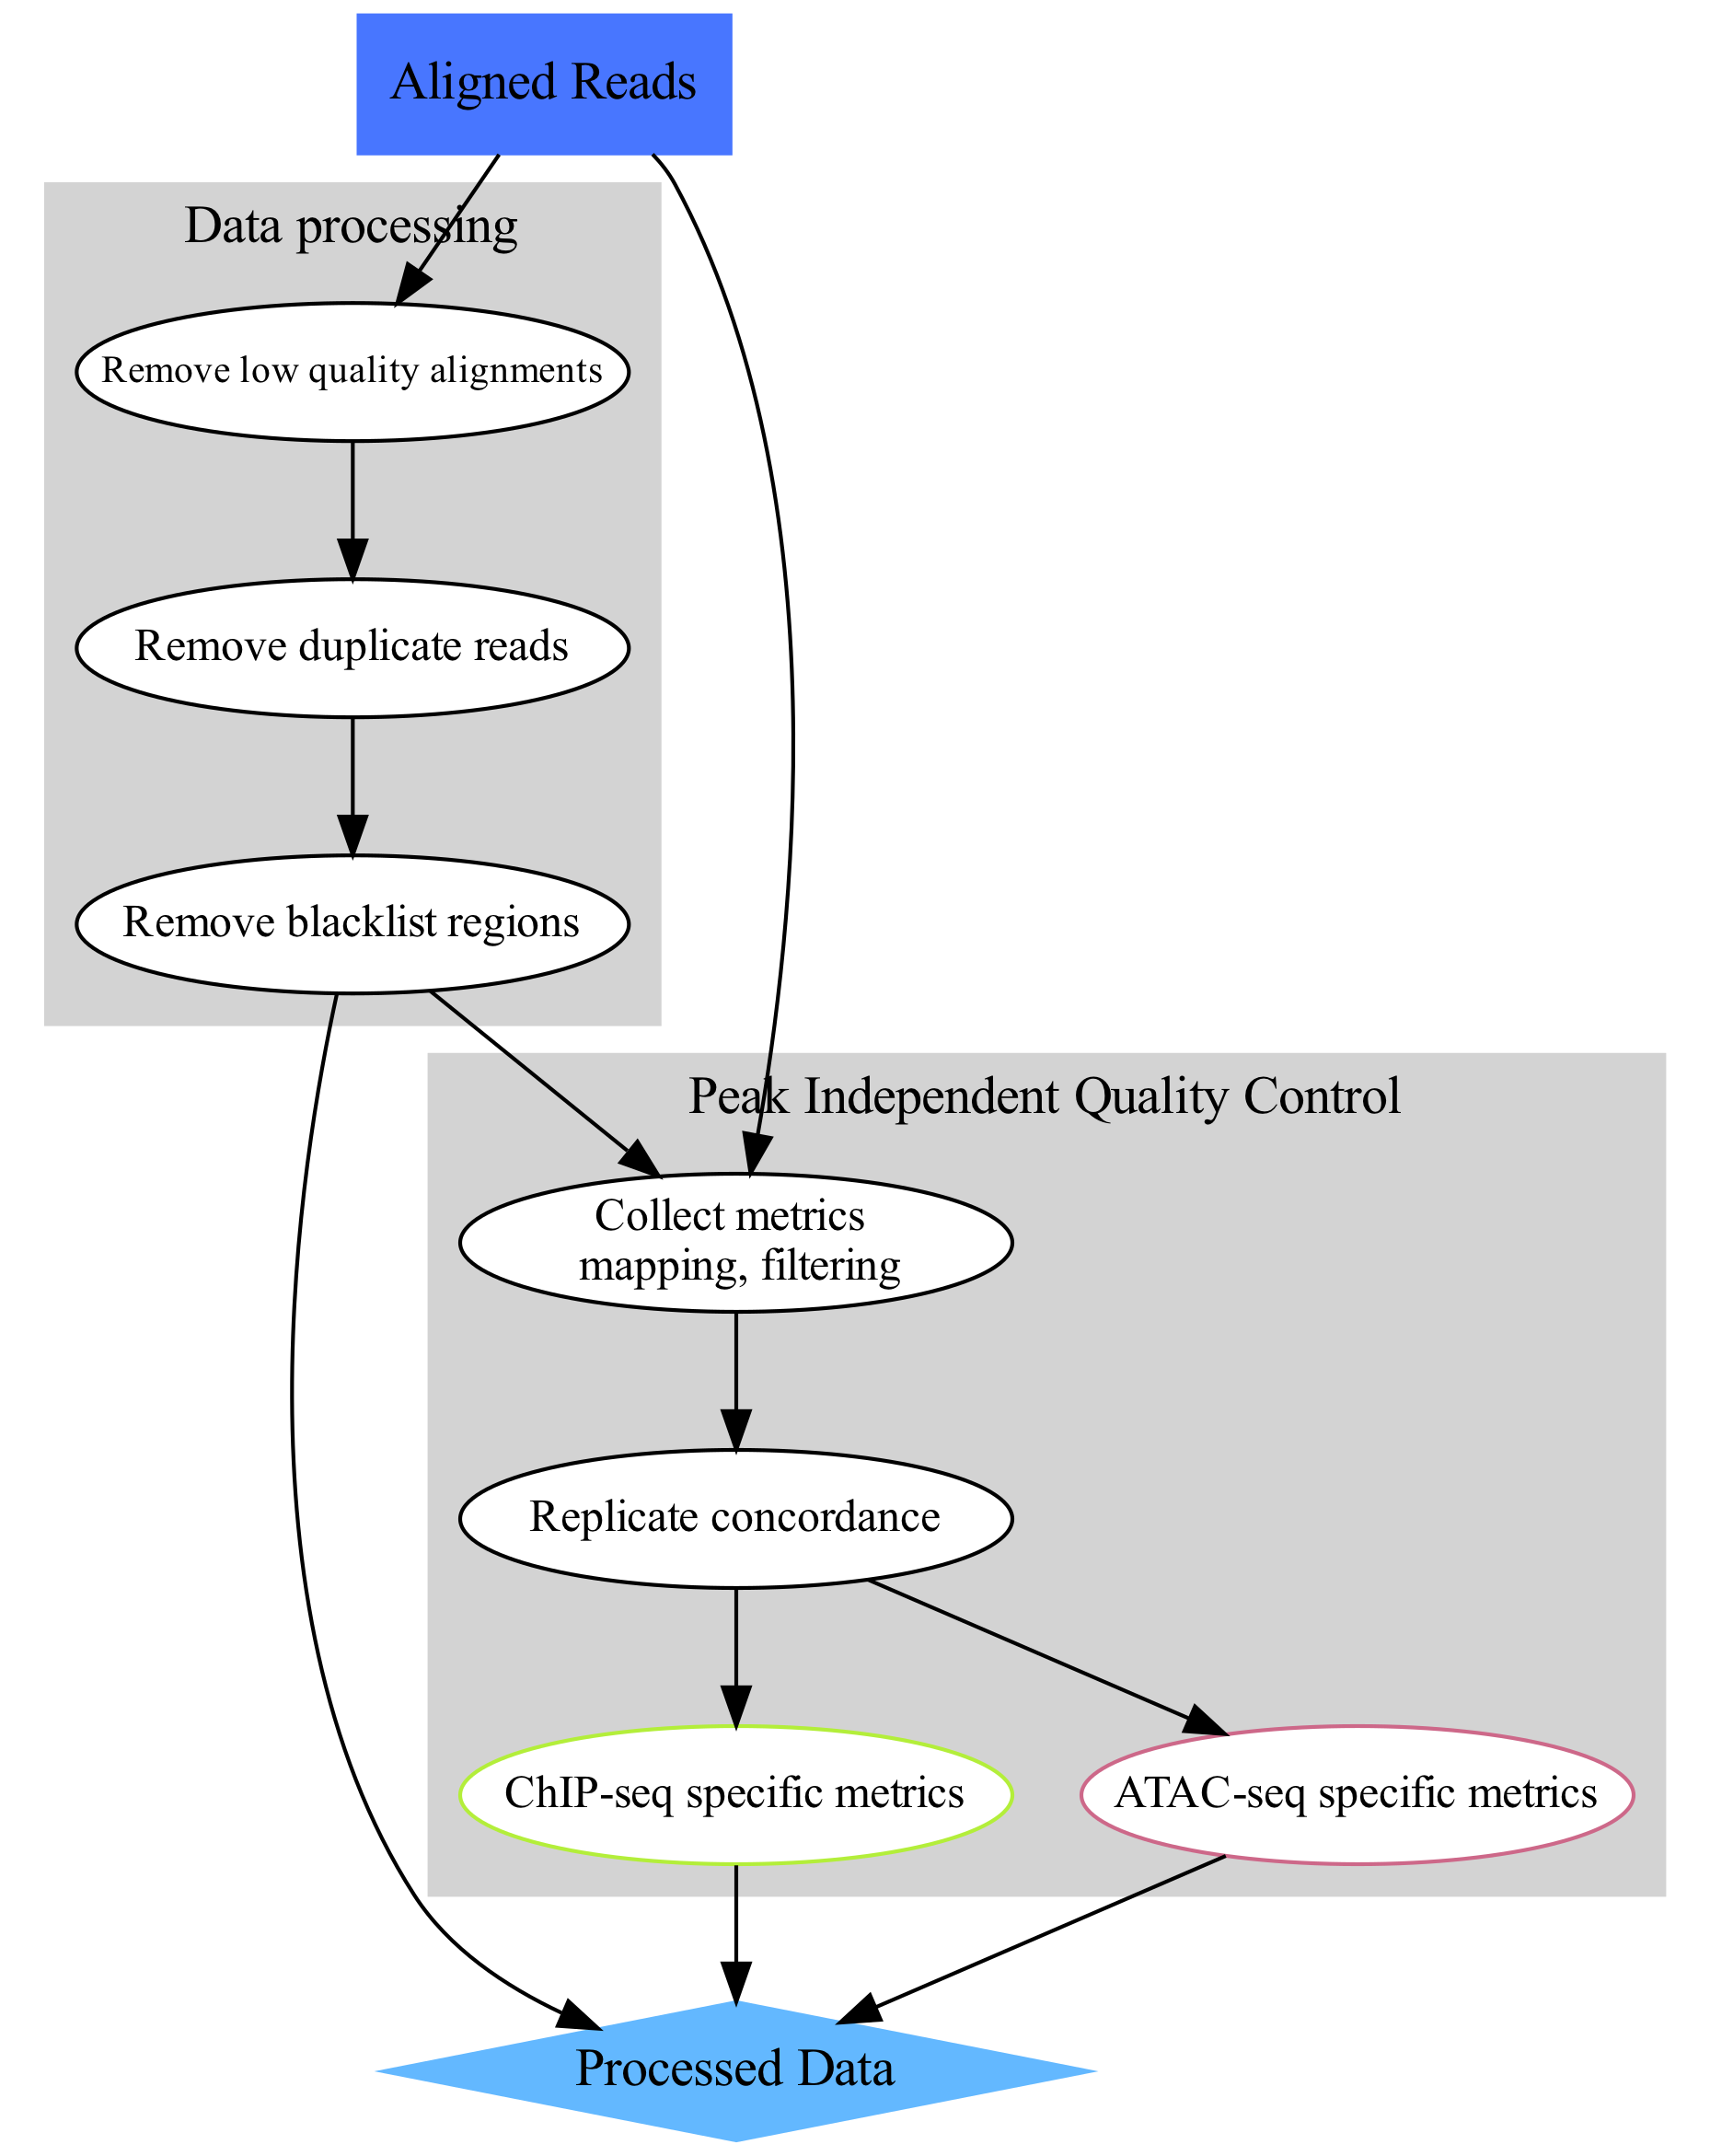
The aim of this part of the data analysis workflow is to perform general signal structure agnostic (i.e. peak - independent) quality control (lower-right part of the concept map). These include:
assessment of read coverage along the genome;
replicate congruency.
Basic read count statistics were already collected in Data preprocessing.
Important
We assume that the environment and directory structure has been already set in Data preprocessing.
Cumulative Enrichment
Cumulative enrichment, aka BAM fingerprint, is a way of assesing the quality of signal concentrated predeminantly in a small fraction of a genome (such as peaks detected in ATAC-seq and ChIP-seq). It determines how well the signal in the sample can be differentiated from the background.
Cumulative enrichment is obtained by sampling indexed BAM files and plotting a profile of cumulative read coverages for each sample. All reads overlapping a window (bin) of the specified length are counted; these counts are sorted and the cumulative sum is plotted.
To compute cumulative enrichment for processed bam files in our ATAC-seq data set (assuming we are in drectory analysis, so if you have followed the previous tutorial, you should move one directory level up cd ..). Here we use files preprocessed earlier:
mkdir deepTools
cd deepTools

#link necessary files to avoid long paths in commands
ln -s ../../data_proc/* .

module load deepTools/3.5.6

plotFingerprint --bamfiles SRR17296554.filt.chr1.bam SRR17296555.filt.chr1.bam SRR17296556.filt.chr1.bam SRR17296557.filt.chr1.bam \
 --binSize=1000 --plotFile Invivo_proc.fingerprint.pdf \
 --smartLabels -p 5 &> fingerprint.log
You can copy the resulting file to your local system to view it.
Copying files from Rackham
To copy files from Rackham you need to know the path to the file on Rackham (i.e. the remote side). Type in the terminal:
pwd
This gives you the path to the working directory, e.g:
$pwd

/proj/epi2025/nobackup/agata/tst/atac_proc/atacseq/analysis/deepTools/
To copy file Invivo_proc.fingerprint.pdf to current directory, type in the local terminal:
scp <username>@rackham.uppmax.uu.se:/path/to/file .
E.g.:
scp agata@rackham.uppmax.uu.se:/proj/epi2025/nobackup/agata/tst/atac_proc/atacseq/analysis/deepTools/Invivo_proc.fingerprint.pdf .
when connecting from abroad
You need to login in another session to be able to copy files, as 2FA does not work with scp. This mock-login serves only to refresh your credentials and results in a few minutes of grace time, during which each session from the same host is accepted without the need to provide 2FA. This time window is sufficient for copying files.
Have a look at Invivo_proc.fingerprint.pdf, read deepTools What the plots tell you and answer
does it indicate a good sample quality, i.e. signal present in narrow regions?
Fingerprint for ATAC-seq signal in Batf KO dataset. Data subset to chr1.

The plot below contains non subset data and more samples presented in the article.
Fingerprint for ATAC-seq signal in Batf KO dataset. Non subset data.

Replicate Clustering
To assess overall similarity between libraries from different samples one can compute sample clustering heatmaps using
multiBamSummary and plotCorrelation in bins mode from deepTools.
In this method the genome is divided into bins of specified size (--binSize parameter) and reads mapped to each bin are counted. The resulting signal profiles are used to cluster libraries to identify groups of similar signal profile.
..We chose to compute pairwise Spearman correlation coefficients for this step, as they are based on ranks of each bin rather than signal values.
In this part we use bam files prepared before the workshop, to save time.
multiBamSummary bins --bamfiles SRR17296554.filt.chr1.bam SRR17296555.filt.chr1.bam SRR17296556.filt.chr1.bam SRR17296557.filt.chr1.bam \
 --smartLabels \
 --outFileName Invivo_proc.npz --binSize 5000 -p 5 &> multiBamSummary.log


plotCorrelation --corData Invivo_proc.npz \
 --plotFile Invivo_proc_correlation_bin.pdf --outFileCorMatrix Invivo_proc_correlation_bin.txt \
 --whatToPlot heatmap --corMethod pearson --plotNumbers

# to change the min number plotted
plotCorrelation --corData Invivo_proc.npz \
 --plotFile Invivo_proc_correlation_bin.pdf --outFileCorMatrix Invivo_proc_correlation_bin.txt \
 --whatToPlot heatmap --corMethod pearson --plotNumbers -min 0.95
You can copy the resulting file to your local system to view it.
What do you think?
which samples are similar?
are the clustering results as you would have expected them to be?
Pearson correlation, data subset to chr1 |
Pearson correlation, data subset to chr1, min 0.95 |
|---|---|

|

|
Pearson correlation, non-subset data |
Spearman correlation, non-subset data |
|---|---|

|

|
In addition to these general procedures, several specialised assay - specific quality metrics exist, which probe signal characteristics related to each method. These are key QC metrics to evaluate the experiment and should always be colleced during the QC step. The method specific tutorials are: ATACseq and ChIPseq.
We can now follow with ATACseq specifc QC methods.