ATAC-seq
ATAC-seq (Assay for Transposase-Accessible Chromatin with high-throughput sequencing) is a method for determining chromatin accessibility across the genome. It utilizes a hyperactive Tn5 transposase to insert sequencing adapters into open chromatin regions. High-throughput sequencing then yields reads that indicate these regions of increased accessibility.

|
This tutorial is a continuation of Data preprocessing, General QC, and ATACseq specifc QC.
Important
We assume that the environment and directory structure has been already set in Data preprocessing.
Data
We will use the same data as before: ATAC-seq libraries prepared to analyse chromatin accessibility status in natural killer (NK) cells without and with stimulation (in duplicates) from the ENCODE project.
Natural killer (NK) cells are innate immune cells that show strong cytolytic function against physiologically stressed cells such as tumor cells and virus-infected cells. NK cells express several activating and inhibitory receptors that recognize the altered expression of proteins on target cells and control the cytolytic function. To read more about NK cells please refer to Paul and Lal . The interleukin cocktail used to stimulate NK cells induces proliferation and activation (Lauwerys et al ).
ENCODE sample accession numbers are listed in Table 1.
No |
Accession |
Cell type |
Description |
|---|---|---|---|
1 |
ENCFF398QLV |
Homo sapiens natural killer cell female adult |
untreated |
2 |
ENCFF363HBZ |
Homo sapiens natural killer cell female adult |
untreated |
3 |
ENCFF045OAB |
Homo sapiens natural killer cell female adult |
Interleukin-18, Interleukin-12-alpha, Interleukin-12-beta, Interleukin-15 |
4 |
ENCFF828ZPN |
Homo sapiens natural killer cell female adult |
Interleukin-18, Interleukin-12-alpha, Interleukin-12-beta, Interleukin-15 |
We have processed the data, starting from reads aligned to hg38 reference assembly using bowtie2. The alignments were obtained from ENCODE in bam format and further processed:
alignments were subset to include chromosome 14 and 1% of reads mapped to chromosomes 1 to 6 and chrM.
This allows you to see a realistic coverage of one selected chromosome and perform data analysis while allowing shorter computing times. Non-subset ATAC-seq data contains 100 - 200 M PE reads, too many to conveniently process during a workshop.
In this workshop, we have filtered and quality-controlled the data (parts Data preprocessing, General QC, and ATACseq specifc QC).
Peak Calling
To find regions corresponding to potential open chromatin, we want to identify ATAC-seq “peaks” where reads have piled up to a greater extent than the background read coverage.
The tools which are currently used are Genrich , MACS2 and MACS3.
Genrich has a mode dedicated to ATAC-Seq (in which it creates intervals centered on transposase cut sites); however, Generich is still not published;
MACS2 is widely used so lots of help is available online; however it is designed for ChIP-seq rather than ATAC-seq;
MACS3 has more ATAC-seq oriented features than its predecessor, however, it is still in active developement, so bugs may happen.
The differences between Genrich and MACS2 in the context of ATAC-seq data are discussed here.
In this tutorial we will use Genrich and MACS3 (rather than MACS2). We will compare the results to peaks detected by MACS2, as used in major data processing pipelines (nf-core, ENCODE).
Shifting Alignments
We have already discussed (and performed) this step in the ATACseq specifc QC tutorial. Briefly, the alignments are shifted to account for the duplication created as a result of DNA repair after Tn5-introduced DNA nicks.
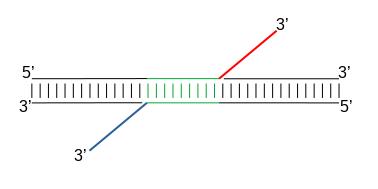
When Tn5 cuts an accessible chromatin locus it inserts adapters separated by 9bp, see Figure 2. This means that to have the read start site reflect the centre of where Tn5 bound, the reads on the positive strand should be shifted 4 bp to the right and reads on the negative strand should be shifted 5 bp to the left as in Buenrostro et al. 2013.
|
To shift or not to shift? It, as always, depends on the downstream application of the alignments.
If we use the ATAC-seq peaks for differential accessibility, and especially if we detect the peaks in the “broad” mode, then shifting does not play any role: the “peaks” are hundreds of bps long, reads are summarised to these peaks / domains allowing a partial overlap, so 9 basepairs of difference has a neglibile effect.
However, when we plan to use the data for any nucleosome-centric analysis (positioning at TSS or TF footprinting), shifting the reads allows to center the signal in peaks flanking the nucleosomes and not directly on the nucleosome. Typically, applications used for these analyses perform the read shifting, so we do not need to preprocess the input bam files.
More on peak calling and which parameters to choose. Historically, ATAC-seq data have been analysed by software developed for ChIP-seq, even though the two assays have different signal structure. The peak caller most widely used has been MACS2 (as evidenced by number of citations), with a wide range of parameters. The discussion on why not all these parameter choices are optimal can be found in Gaspar 2018. In this exercise you will see MACS2/3 callpeak algorithm used in three different settings, and compare the results to a novel method developed specifically for ATAC-seq hmmratac
Genrich
We start this tutorial in directory atacseq/analysis/:
mkdir peaks
cd peaks
We need to link necessary files first.
mkdir genrich
cd genrich

# we link the pre-processed bam file
ln -s ../../processedData/ENCFF045OAB.chr14.blacklist_M_filt.mapq5.dedup.bam ENCFF045OAB.chr14.proc.bam
ln -s ../../processedData/ENCFF045OAB.chr14.blacklist_M_filt.mapq5.dedup.bam.bai ENCFF045OAB.chr14.proc.bam.bai

# because we want to use the other replicate for peak calling, we link its files as well
ln -s ../../../data_proc/ENCFF828ZPN.chr14.proc.bam
ln -s ../../../data_proc/ENCFF828ZPN.chr14.proc.bam.bai
Hint
If you got lost on the way, you can link files preprocessed by us:
ln -s ../../../data_proc/ENCFF045OAB.chr14.proc.bam ENCFF045OAB.chr14.proc.bam
ln -s ../../../data_proc/ENCFF045OAB.chr14.proc.bam.bai ENCFF045OAB.chr14.proc.bam.bai
Genrich requires bam files to be name-sorted rather than the default coordinate-sorted. Also, we remove all reference sequences other than chr14 from the bam header, as this is where our data is subset to. Genrich uses the reference sequence length from bam header in its statistical model, so retaining the original bam header would impair peak calling statistics.
# in case not already loaded
module load bioinfo-tools
module load samtools/1.8


#subset bam and change header
samtools view -h ENCFF045OAB.chr14.proc.bam chr14 | grep -P "@HD|@PG|chr14" | samtools view -Shbo ENCFF045OAB.chr14.proc_rh.bam
samtools view -h  ENCFF828ZPN.chr14.proc.bam chr14 | grep -P "@HD|@PG|chr14" | samtools view -Shbo  ENCFF828ZPN.chr14.proc_rh.bam


# sort the bam file by read name (required by Genrich)
samtools sort -n -o ENCFF045OAB.chr14.proc_rh.nsort.bam -T sort.tmp  ENCFF045OAB.chr14.proc_rh.bam
samtools sort -n -o ENCFF828ZPN.chr14.proc_rh.nsort.bam -T sort.tmp  ENCFF828ZPN.chr14.proc_rh.bam
Genrich can apply the read shifts when ATAC-seq mode -j is selected. We detect peaks by:
/sw/courses/epigenomics/ATACseq_bulk/software/Genrich/Genrich -j -t ENCFF045OAB.chr14.proc_rh.nsort.bam -o ENCFF045OAB.chr14.genrich.narrowPeak
The output file produced by Genrich is in ENCODE narrowPeak format, listing the genomic coordinates of each peak called and various statistics.
chr start end name score strand signalValue pValue qValue peak

signalValue - Measurement of overall (usually, average) enrichment for the region.
pValue - Measurement of statistical significance (-log10). Use -1 if no pValue is assigned.
qValue - Measurement of statistical significance using false discovery rate (-log10). Use -1 if no qValue is assigned.
How many peaks were detected?
wc -l ENCFF045OAB.chr14.genrich.narrowPeak
1027 ENCFF045OAB.chr14.genrich.narrowPeak
ENCFF045OAB.chr14.genrich.narrowPeak
You can inspect file contents:
head ENCFF045OAB.chr14.genrich.narrowPeak
chr14   18332340        18333050        peak_0  490     .       347.820770      3.316712        -1      372
chr14   18583390        18584153        peak_1  1000    .       1267.254150     6.908389        -1      474
chr14   19061839        19062647        peak_2  732     .       591.112671      4.484559        -1      472
chr14   19337360        19337831        peak_3  1000    .       517.304626      4.484559        -1      373
chr14   19488517        19489231        peak_4  393     .       280.354828      2.916375        -1      210
chr14   20216750        20217291        peak_5  1000    .       625.121826      4.537151        -1      441
We can now process the remaining replicate:
/sw/courses/epigenomics/ATACseq_bulk/software/Genrich/Genrich -j -t ENCFF828ZPN.chr14.proc_rh.nsort.bam -o ENCFF828ZPN.chr14.genrich.narrowPeak
Genrich can also call peaks for multiple replicates collectively. First, it analyzes the replicates separately, with p-values calculated for each. At each genomic position, the multiple replicates’ p-values are then combined by Fisher’s method. The combined p-values are converted to q-values, and peaks are output.
This part of the tutorial has been modified 17 Sep 2024 to correct error in command line formatting which lead genrich to use only the last listed bam file for read mapping.
For comparison, use the joint replicate peak calling mode:
/sw/courses/epigenomics/ATACseq_bulk/software/Genrich/Genrich -j -t ENCFF045OAB.chr14.proc_rh.nsort.bam,ENCFF828ZPN.chr14.proc_rh.nsort.bam -o nk_stim.chr14.genrich.narrowPeak
How many peaks were detected by Genrich?
      wc -l *narrowPeak

1027 ENCFF045OAB.chr14.genrich.narrowPeak
1007 ENCFF828ZPN.chr14.genrich.narrowPeak
2115 nk_stim.chr14.genrich.narrowPeak
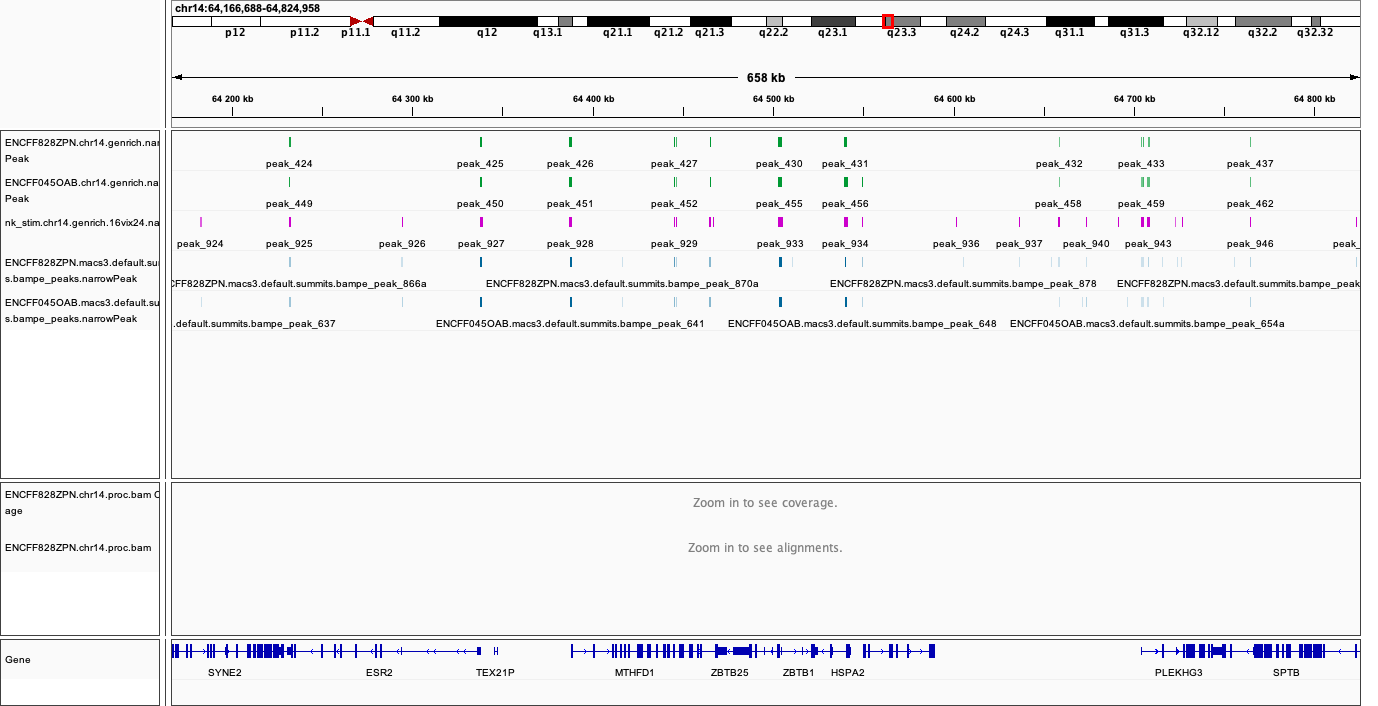
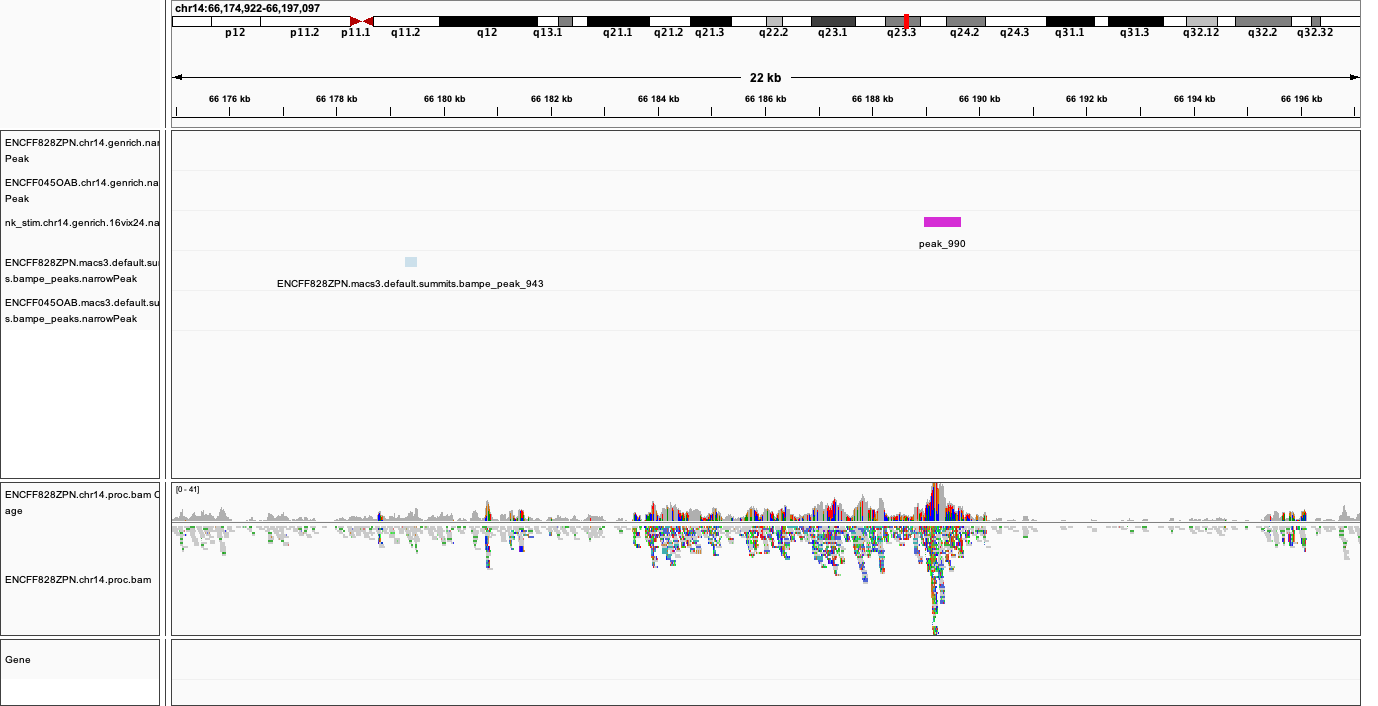
It turns out Genrich detected more peaks in the joint mode, including in locations not picked up in neither of the individual libraries. Some of these locations have been also detected by MACS3 callpeak, see figures below. This requires further investigation and comparisons, for now however we can conclude that adding more replicates improves the sensitivity of peak calling. Upon inspection of alignments in bam files and peak calls, many of the peaks called only in joint replicate analysis tend to have lower signal-to-noise ratio than peaks detected also in individual replicates.
|

|
|
MACS
As mentioned in the introduction, MACS has been used with a variety of parametr choices to detect peaks in ATAC-seq data.
You can encounter various combinations of read input modes (BAM, BAMPE, BED and BEDPE; BED / BAM designaed for SE data used also for PE data), and peak calling modes (default “narrow” and optional “broad”). Some protocols shift reads (setting options extsize and shift). In this tutorial we would like to demonstrate differences these settings make on the final result. We will begin by using two algorithms from the newest version of MACS3: the original callpeak and ATAC-seq specific hmmratac. In the next part we will visualise resulting peaks and compare them to peaks detected using MACS2, as implemented in the ENCODE and nf-core ATAC-seq pipelines.
MACS3
First, we create a separate directory for results obtained using MACS3:
mkdir -p ../macs3
cd ../macs3
The newest version of MACS3 (3.0.0b3) is not available via Rackham module system. We have installed it in a conda environment, so we need to activate it:
module load conda
conda activate /sw/courses/epigenomics/software/conda/macs3
We are now ready to call the peaks using macs3 callpeak. We will use the same file as for Genrich, and the genome size of 107043718 (length of chr 14).
macs3 callpeak -f BAMPE --call-summits -t ../genrich/ENCFF045OAB.chr14.proc_rh.nsort.bam -g 107043718 -n ENCFF045OAB.macs3.default.summits.bampe -B -q 0.05
If the previous step was very fast, the next one may take longer (ca 20 minutes). We will use macs3 hmmratac developed for ATAC-seq data, which classifies fragments into background, nucleosome and open (nucleosome-free), and uses a model to learn the chromatin structure around the open regions, to separate signal from background.
Assuming we are still in the active conda environment from the previous step:
macs3 hmmratac -b ../genrich/ENCFF045OAB.chr14.proc_rh.nsort.bam -n ENCFF045OAB.macs3.hmmratac.bampe
If you feel you do not want to wait 20 minutes for this command to finish, you can copy the results and proceed:
cp ../../../results/peaks/macs3/ENCFF045OAB.macs3.hmmratac.bampe_accessible_regions.gappedPeak .
How many peaks were detected?
1852 ENCFF045OAB.macs3.default.summits.bampe_peaks.narrowPeak
1234 ENCFF045OAB.macs3.hmmratac.bampe_accessible_regions.gappedPeak
We can see that the numbers are in the same ballpark, as for Genrich. We expect that some calls will be different, but more or less these results seem to go in line with one anoter.
MACS2 in Data Processing Pipelines
So what happens if we want to use MACS2, or an out of the box data processing pipeline?
To save time, you can copy the results:
cd ..
cp -r ../../results/peaks/macs2 .
Commands used to detect peaks using MACS2.
ENCODE uses unpaired BED file and extends and shifts reads:
module load MACS/2.2.6
module load BEDTools/2.25.0

bedtools bamtobed -i ../genrich/ENCFF045OAB.chr14.proc_rh.nsort.bam >ENCFF045OAB.chr14.bed

macs2 callpeak -t ENCFF045OAB.chr14.bed \
-n ENCFF045OAB.chr14.macs2.encode -f BED \
-g 107043718 -q 0.05 --nomodel --shift -75 --extsize 150 \
--call-summits --keep-dup all
nf-core uses paired-BAM and calls broad peaks:
module load MACS/2.2.6

macs2 callpeak --broad -t ../genrich/ENCFF045OAB.chr14.proc_rh.nsort.bam \
-n ENCFF045OAB.chr14.macs2.nfcore -f BAMPE \
-g 107043718 -q 0.05 --nomodel --keep-dup all
How many peaks are found?
11946 ENCFF045OAB.chr14.macs2.encode_peaks.narrowPeak
 2011 ENCFF045OAB.chr14.macs2.nfcore_peaks.broadPeak
There is a great difference in numbers between these two methods. Let’s inspect all the calls in IGV to learn more about these results.
Inspecting Peak Calling Results in IGV
You can copy the tracks to your local system and load them to IGV, alongside the bam file (needs to be indexed). Lets’s prepare the data:
cd ..

cp genrich/*Peak for_vis/
cp macs2/*Peak for_vis/
cp macs3/*Peak for_vis/
cp genrich/ENCFF045OAB.chr14.proc.bam for_vis/ENCFF045OAB.chr14.proc.bam
cp genrich/ENCFF045OAB.chr14.proc.bam.bai for_vis/ENCFF045OAB.chr14.proc.bam.bai
You can now copy the directory for_vis using scp -r to your local system.
Peaks called using different methods.
If you got lost in the peak calling madness, you can copy the directories with the results prepared earlier. Assuming you are in peaks:
cp -r ../../results/peaks/macs3 .
cp -r ../../results/peaks/genrich .
cp -r ../../results/peaks/macs2 .
When on your local system, load the tracks to IGV (the reference is hg38). Several candidate locations illustrating the differences in results:
chr14:64,329,035-64,349,605
chr14:64,166,688-64,824,958
chr14:63,912,817-66,545,900
chr14:35,797,163-38,430,246
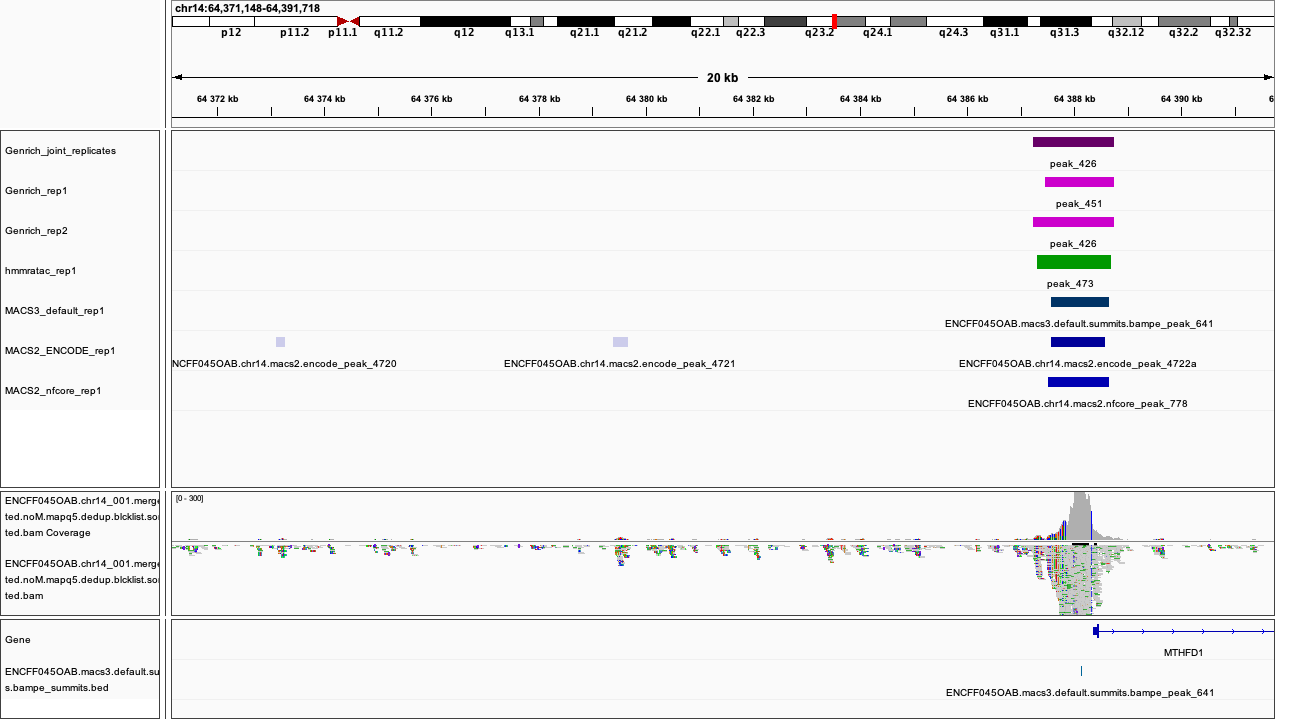
chr14:64,371,148-64,391,718
chr14:64,434,671-64,455,241
chr14:64,538,366-64,579,507
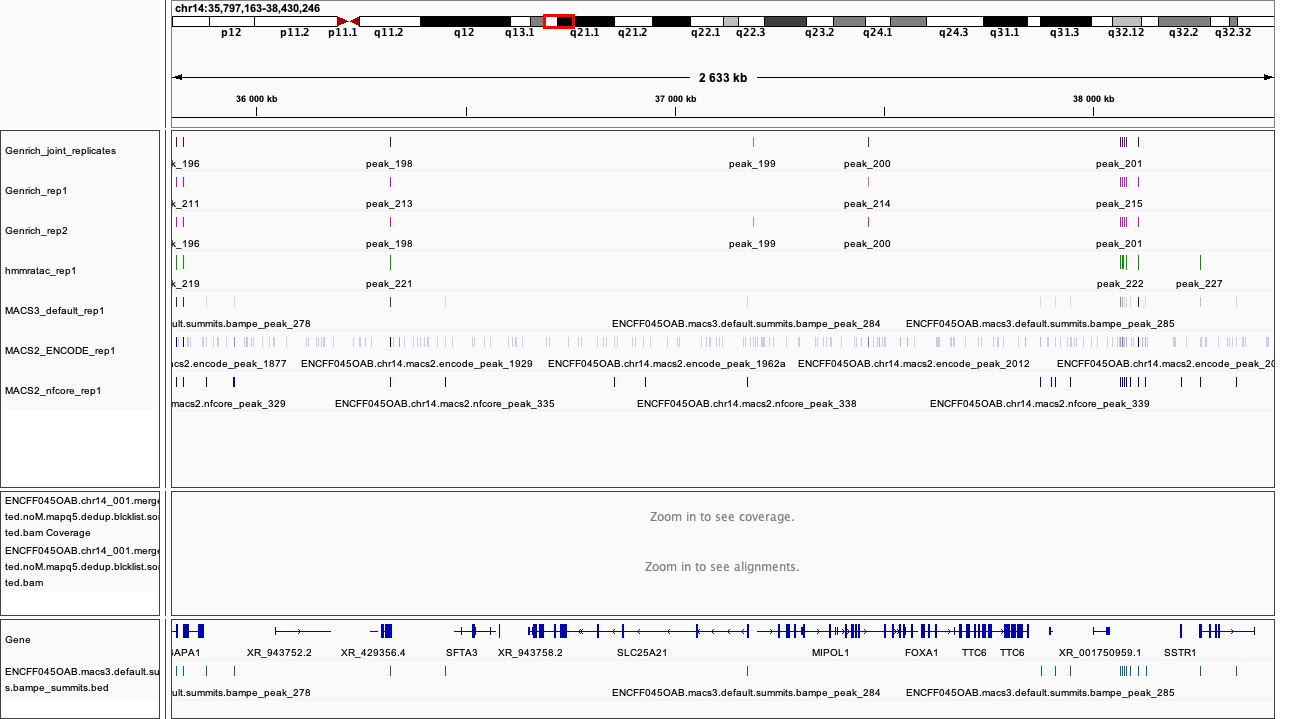
Figures below use the same colour scheme, tracks from top:
Genrich (dark magenta), peaks called on joint replictaes
Genrich (light magenta), peaks for replicate 1
Genrich (light magenta), peaks for replicate 2
macs3 hmmratac (green), eplicate 1
macs3 callpeak (blue-grey), default settings, replicate 1
macs2 encode (indigo), replicate 1
macs2 nf-core (indigo), replicate 1
processed bam file with coverage
gene models

|

|
|
|

|

|
After inspecting these plots as well as browsing more locations in IGV, you can notice the differences between the results produced by different peak callers and effects of parameter choice. You can also see which peak calls have better support in read coverage and signal-to-noise ratio. This also demonstrates that, the peak calling results should be filtered to select reproducible peaks with good signal-to-noise ratio, as the “raw calls” may contain artefacts, some technical and some due to biology.
DISCLAIMER This short presentation of effect of parameter choice on peak calling is not meant to discredit the ENCODE ATAC-seq processing pipeline. The ENCODE pipeline contains further peak filtering steps and IDR thresholding, and the final peak set differs greatly from the raw results obtained from the peak caller.
Peak Overlap
Peaks called using different methods.
If you got lost in the peak calling madness, you can copy the directories with the results prepared earlier. Assuming you are in peaks:
cp -r ../../results/peaks/macs3 .
cp -r ../../results/peaks/genrich .
cp -r ../../results/peaks/macs2 .
Comparing results of MACS and Genrich
How many peaks overlap between replicates? How many overlap between different methods? Let’s check, on the results of MACS3 peak calling. We use bedtools intersect with two parameters which change the default behaviour:
-f 0.50- the overlap is to encompass 50% of peak length-r- the overlap is to be reciprocal
This results in peaks which overlap in 50% of their length, which we can consider reproducible.
Assuming you are in peaks (you may have to cd ..)
mkdir overlaps
cd overlaps

#link the results of peak calling for sample ENCFF828ZPN
ln -s  ../../../results/peaks/macs3/ENCFF828ZPN.macs3.default.summits.bampe_peaks.narrowPeak

module load BEDTools/2.25.0

bedtools intersect -a ../macs3/ENCFF045OAB.macs3.default.summits.bampe_peaks.narrowPeak  -b ../macs3/ENCFF828ZPN.macs3.default.summits.bampe_peaks.narrowPeak  -f 0.50 -r >peaks_overlap.nk_stim.macs3.bed

bedtools intersect -a ../macs3/ENCFF045OAB.macs3.default.summits.bampe_peaks.narrowPeak -b ../genrich/ENCFF045OAB.chr14.genrich.narrowPeak  -f 0.50 -r >peaks_overlap.ENCFF045OAB.macs3.genrich.bed

wc -l *bed
951 peaks_overlap.ENCFF045OAB.macs3.genrich.bed
  2021 peaks_overlap.nk_stim.macs3.bed
Consensus Peaks
As our experiment has been replicated, we can select the peaks which were detected in both replicates of each condition. This removes non-reproducible peaks in regions of low coverage and other artifacts.
In this section we will work on peaks detected earlier using non-subset data.
First we link necessary files:
mkdir consensus
cd consensus

ln -s ../../../../results/peaks/macs3/ENCFF045OAB.macs3.default.summits.bampe_peaks.narrowPeak ENCFF045OAB.macs3.narrowPeak
ln -s ../../../../results/peaks/macs3/ENCFF363HBZ.macs3.default.summits.bampe_peaks.narrowPeak ENCFF363HBZ.macs3.narrowPeak
ln -s ../../../../results/peaks/macs3/ENCFF398QLV.macs3.default.summits.bampe_peaks.narrowPeak ENCFF398QLV.macs3.narrowPeak
ln -s ../../../../results/peaks/macs3/ENCFF828ZPN.macs3.default.summits.bampe_peaks.narrowPeak ENCFF828ZPN.macs3.narrowPeak
To recap, ENCFF398QLV and ENCFF363HBZ are untreated and ENCFF045OAB and ENCFF828ZPN are stimulated NK cells.
Let’s select peaks which overlap at their 50% length in both replicates (assuming we are in consensus):
module load BEDTools/2.25.0

bedtools intersect -a ENCFF363HBZ.macs3.narrowPeak -b ENCFF398QLV.macs3.narrowPeak  -f 0.50 -r >nk_peaks.bed
bedtools intersect -a ENCFF045OAB.macs3.narrowPeak -b ENCFF828ZPN.macs3.narrowPeak  -f 0.50 -r >nk_stim_peaks.bed
How many peaks?
     wc -l *Peak

1852 ENCFF045OAB.macs3.narrowPeak
1910 ENCFF363HBZ.macs3.narrowPeak
2666 ENCFF398QLV.macs3.narrowPeak
2482 ENCFF828ZPN.macs3.narrowPeak
How many overlap?
wc -l *bed
 2350 nk_peaks.bed
 2021 nk_stim_peaks.bed
Merged Peaks
We can now merge the consensus peaks into peak sets used for downstream analyses.
module load BEDOPS/2.4.39

bedops -m nk_peaks.bed nk_stim_peaks.bed > nk_merged_peaks.bed
How many?:
1701 nk_merged_peaks.bed
The format of nk_merged_peaks.bed is a very simple, 3-field BED file. Let’s add peaks ids and convert it to saf:
awk -F $'\t' 'BEGIN {OFS = FS}{ $2=$2+1; peakid="nk_merged_macs3_"++nr;  print peakid,$1,$2,$3,"."}' nk_merged_peaks.bed > nk_merged_peaks.saf

awk -F $'\t' 'BEGIN {OFS = FS}{ $2=$2+1; peakid="nk_merged_macs3_"++nr;  print $1,$2,$3,peakid,"0","."}' nk_merged_peaks.bed > nk_merged_peaksid.bed
These files can now be used in peak annotation and in comparative analyses, for example differential accessibility analysis.
We can now follow with downstream analyses: Peak Annotation, Differential Accessibility and TF footprinting.
Fraction of Reads in Peaks
Fraction of Reads in Peaks (FRiP) is one of key QC metrics of ATAC-seq data. According to ENCODE ATACseq data standards acceptable FRiP is >0.2. This value of course depends on the peak calling protocol, and as we have seen in the previous section, the results may vary …a lot. However, it is worth to keep in mind that any samples which show different value for this (and other) metric may be outliers problematic in the analysis.
To calculate FRiP we need alignment file (bam) and peak file (narrowPeak, bed).
Assuming we are in peaks:
mkdir frip
cd frip
We will use a tool called featureCounts from package Subread. This tool accepts genomic intervals in formats gtf/gff and saf. Let’s convert narrow/ broadPeak to saf:
ln -s ../macs3/ENCFF045OAB.macs3.default.summits.bampe_peaks.narrowPeak

awk -F $'\t' 'BEGIN {OFS = FS}{ $2=$2+1; peakid="macs3Peak_"++nr;  print peakid,$1,$2,$3,"."}' ENCFF045OAB.macs3.default.summits.bampe_peaks.narrowPeak > ENCFF045OAB.chr14.macs3.saf
ENCFF045OAB.chr14.macs3.saf
macs3Peak_1     chr14   18674027        18674238        .
macs3Peak_2     chr14   19098500        19098851        .
macs3Peak_3     chr14   19105557        19105809        .
macs3Peak_4     chr14   19161076        19161474        .
macs3Peak_5     chr14   19161804        19162012        .
macs3Peak_6     chr14   19172873        19173211        .
macs3Peak_7     chr14   19237710        19237986        .
We can now summarise reads:
ln -s ../genrich/ENCFF045OAB.chr14.proc_rh.nsort.bam

module load subread/2.0.0
featureCounts -p -F SAF -a ENCFF045OAB.chr14.macs3.saf --fracOverlap 0.2 -o ENCFF045OAB.peaks_macs3.counts ENCFF045OAB.chr14.proc_rh.nsort.bam
This command has produced reads summarised within each peak (which we won’t use at this stage) and a summary file ENCFF045OAB.peaks_macs3.counts.summary which contains values we are interested in:
Status  ENCFF045OAB.chr14.proc_rh.nsort.bam
Assigned        310115
Unassigned_Unmapped     0
Unassigned_Read_Type    0
Unassigned_Singleton    0
Unassigned_MappingQuality       0
Unassigned_Chimera      0
Unassigned_FragmentLength       0
Unassigned_Duplicate    0
Unassigned_MultiMapping 0
Unassigned_Secondary    0
Unassigned_NonSplit     0
Unassigned_NoFeatures   1268751
Unassigned_Overlapping_Length   5759
Unassigned_Ambiguity    79272
310115/(310115+1268751+5759+79272) = 0.186 (i.e. 18.6%)
featureCounts reported in the output to the screen (STDOUT) that 18.6% reads fall within peaks, and this is FRiP for sample ENCFF045OAB.
Note
Please note that the values of FRiP depend on the peak calling protocol. Methods producing many more peaks (such as used in the ENCODE pipeline) will result in higher FRiP values. Thus, when comparing values in given experiment to data standards (such as from ENCODE), it is important to know the details of data processing used to derive given statistic.
In this case, for example, we know that the method we used produces significantly less peaks than the “ENCODE method”, therefore we should not discount this particular sample, because the lower FRiP is expected.